Visits to Purchase revisited in Google Analytics
I still like the Visits to Purchase report in Google Analytics even though it may be sub-optimal.
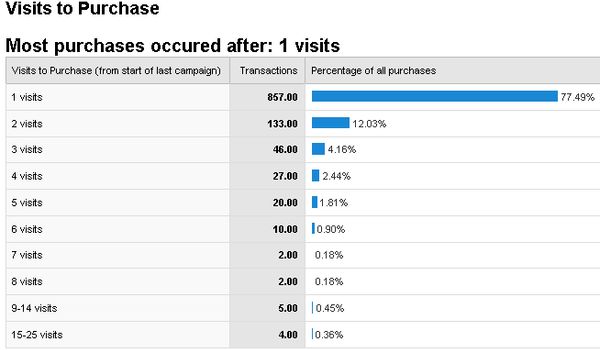
At first glance you could be led to believe that 77% of transactions occur in a single visit. If almost 80% of your transactions come from single visits then why bother with attribution management? There are many other things you could be doing before worrying about those 20% multi-visit conversions.
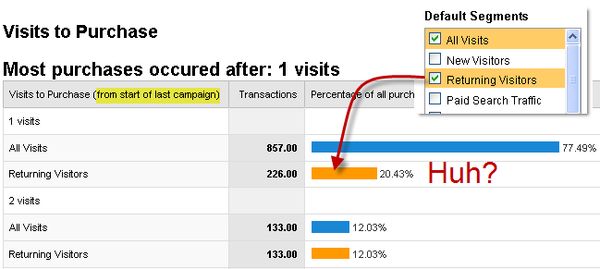
So what’s the issue? If you segment this report by Returning Visitors a different picture emerges:
How can you be a returning visitor with just one visit? Surely you’d have to have visited the site at least twice to be counted as a returning visitor. This great question was addressed by Avinash Kaushik a while ago, and the answer lies in the label in the column header (highlighted in yellow): from the start of last campaign.
A campaign in Google Analytics is basically traffic from any source other than direct type-ins or bookmarks. So mainly traffic from search engines and other sites. But the key point here is last campaign. It means that Google Analytics doesn’t count the visits before the last campaign.
What does this look like in practice? Consider these two visitors:
One visit: Yahoo! Organic (conversion)
5 visits: 1st visit: Google CPC > 2nd visit: Yahoo! Organic > 3rd visit: Bing CPC > 4th visit: twitter.com referral > 5th visit: Yahoo! Organic (conversion)
Since the last campaign for both visitors is Yahoo! Organic, both scenarios would be attributed to 1 Visits in the report, even though only the first visitor actually converted in one visit. There could have been one or twenty prior visits in the second scenario and it would still be in the 1 Visits section. Therefore it’s not really a true count of Visits to Purchase report, nor do we know what the sources of any prior visits are.
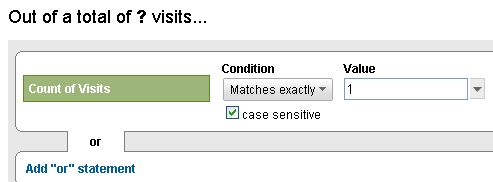
Fortunately, it is pretty easy to get a true** **count of visits report using advanced segments. There is a handy dimension appropriately called Count of Visits that you can use:
This one is for single visits. I also created segments for other visit counts:
If you’d like to grab them directly and apply to your Google Analytics profile, here are the segments 1-timer, 2-timer and 3-timer+
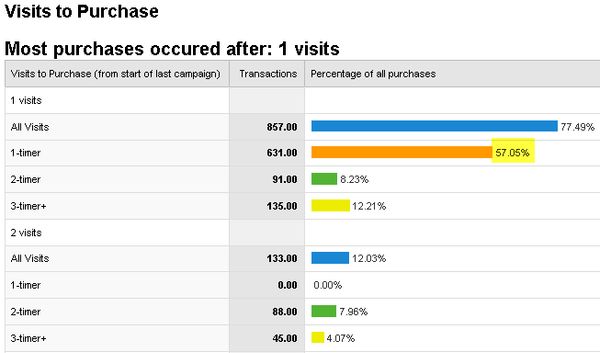
Now apply these segments to the Visits to Purchase report and a more interesting picture emerges:
What we see now is that in fact closer to 50% of transactions truly occur in one visit. Maybe we do have to pay attention to attribution?
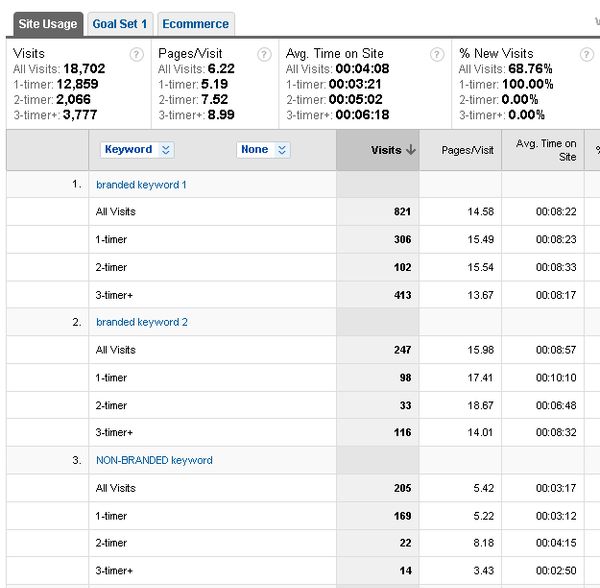
But the true power of using these count of visits segments is in other reports, such as your keywords:
What is interesting to see is the distribution of the visit counts for branded and non-branded keywords. As might be expected, branded keywords drive a lot of traffic for repeat visits and have a relatively small percentage in the one visit count segment; for branded keyword 1 it’s only 306/821 = 37%. Contrast that to the non-branded keyword: here 169/205 = 82% of visits are in the 1-timer segment. Very few people would use the non-branded keyword to get back to your site on subsequent visits. Another way to look at this is that non-branded keywords tend to be earlier in the sales cycle than branded keywords.
What you are hoping for is that you make a good enough first impression on the non-branded first visit to drive subsequent visits through branded keywords. Easier said than done, but getting a better understanding of the underlying behavior of your site visitors through web analytics is a step in the right direction. I highly recommend segmenting your data using Count of Visits and you’ll be pleasantly surprised at the number of valuable nuggets you’ll uncover.
