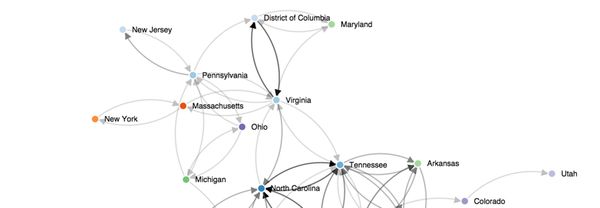
Force-directed graph of website visitors from multiple regions
A perhaps overlooked aspect of the increasingly large percentage of mobile traffic to your site is the fact that those users are mobile in the true sense of the word, i.e. visiting your site from multiple locations. The wonderful Google Analytics API now allows you to ask some powerful questions of your data on a user basis. You can segment your data based on multiple conditions and sequences, so that questions such as this one are possible:
Select users who visited my site in December from North Carolina,
but who then had a subsequent visit from a different state.
You can try this exact question on your data with the Query Explorer.
You'll want to repeat this query for all states and then merge the results. I automated this process using R and RGA to generate a csv file that can be plugged into a graph such as this force-directed graph using D3.
