Top Content and Top Landing Pages reports in Google Analytics
The Top Content and Top Landing Pages reports are super important, but I sometimes wish I could see some of the data from both reports in one place.
But first, let’s take a look at the standard Top Content report:
- Pageviews. I am not a huge fan of just pageviews (who cares if people view or reload the same page a few times during the same session?)
- Unique Pageviews. Much better than pageviews because this will approximate the number of visits.
- Average Time on Page. Hard to take action on, plus it’s an average.
- Bounce rate. OK we could keep that, but there is no data that tells me how many entrances we have for this page. The 39.55% bounce rate is not tied to the pageviews numbers in the same row.
- % Exit. Yeah, not sure about this one either and how to optimize or take action.
- $Index. I actually like this one because it ties in revenue. But retailers tend to pay more attention to real dollar values than a calculated metric.
Here is the type of data I like to see when working with Content. You can follow along by grabbing the custom report I created.
- Unique Pageviews. As before.
- Entrances. This to me is very important. I want to know if this page is a landing page.
- Bounces. Makes much more sense next to Entrances. The data is now in context.
- Revenue and Transactions. Aren’t those numbers more impressive than $Index?
This is kind of a mix between the Top Content and Top Landing pages report.
A couple of notes. We can verify that the bounce rate is indeed 231/584= 39.55%, but we can’t use Bounce Rate as a metric in this custom report. Revenue and Transactions are are associated with each pageview in a visit that leads to a transaction. These transactions are not independent and when you add up them up you’ll end up with a huge number. What we can say is that page X had a hand in Y transactions, along with lots of other pages. Doesn’t matter though since we are really more concerned about the relative importance of these pages, which is what the $Index is for. The $Index tries to answer the question: What pages are most important in contributing to revenue? You can read more about the attribution model Google Analytics uses.
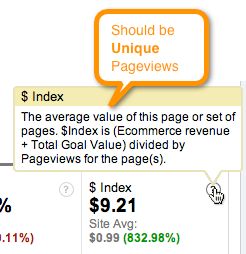
We can actually verify how the $Index is calculated: Revenue/Unique Pageviews. In the above example, $16,205/2,348 = 6.90. By the way, it would be more correct to use unique pageviews in the tooltip:
Lets move on to the actionable part. To me the biggie here is the inclusion of Entrances in the same report. And of course, many insights come when you segment your data.
Let’s segment the original Top Content by Paid Search:
At first glance I am not sure what to make of the 0.00% bounce rate. Unlikely that our ads are that good!
Now lets look at the Top Content v2:
We can see that about 25% of the views of this page were in fact entrances. But the more interesting bit is that it turns out that this page is not actually a paid search landing page! The paid search traffic landed on other pages before visiting the page, which you can see by drilling down in the report.
I am not suggesting a causal link, but I am wondering what would happen if we **send paid search traffic directly to this page? **How well is traffic converting for those others sources of traffic that land on this page?


