Bounce rate and revenue per visit analysis
Web AnalyticsEveryone loves bounce rate. Bounce rate analysis is a great way to start any optimization campaign as it gives you a quick and easy-to-understand metric that tells you what works and what doesn’t on your site. The higher the bounce rate the higher the proportion of visitors who leave immediately once they get to your site. In general, high bounce rate = bad and low bounce rate = good, but you should be less concerned about the absolute value, eg a 55% bounce rate, than with reducing the bounce rate over time, e.g. from 55% to 45%. It’s all about the journey, eh?
Although you will see global bounce rate reports, there are in fact many **different **bounce rates. Each landing page has a bounce rate, as do your referring keywords and sites. Use the segmentation capabilities in your web analytics tool to drill down and start investigating: Why is traffic from this keyword bouncing off my site? How come traffic from that external site is apparently unqualified? Once you start asking specific questions you will start finding specific solutions.
All ready to start bringing down that bounce rate? Great, but how much effort and time and money should you invest in bring down the bounce rate of one of your landing pages? Although you may find a page with a high bounce rate, it may not be worth optimizing it if the traffic to it is very low. In fact, I guarantee that you will have keywords that have a 100% bounce rate! But if only one person came to your site on that keyword, it’s not exactly high-value traffic. And of course, doing any kind of optimization will have a cost attached to it.
To help you prioritize, you should also take into account the value of your landing pages and keywords.
Here is an example you can use if you are using Google Analytics. You can of course do the same sort of thing in Yahoo! Web Analytics, which I have had the honour to write about on the official Yahoo! Store blog. A big hat tip also goes to my friend Rob Snell who has provided a huge amount of creative input.
As an added bonus I will be highlighting some uses of the relatively new custom report and advanced segmentation capabilities in Google Analytics. I do assume that my audience has e-commerce tracking enabled in GA, but you should be able to swap out e-commerce revenue with goal values if you don’t have an e-commerce site.
To get started, simply click here to add my Entry Pages with per visit values report custom report to your GA profile. You can of course also create it by hand. This is what it should look like:
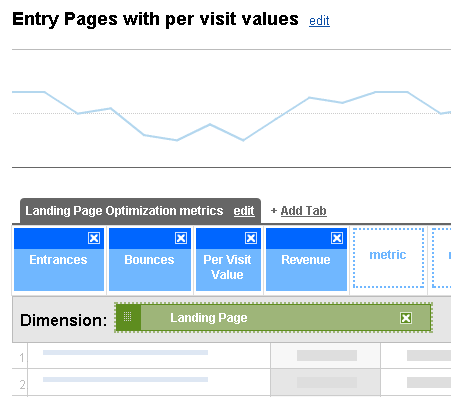
This custom report shows you the entrances and bounces and per visit revenue for your landing pages.
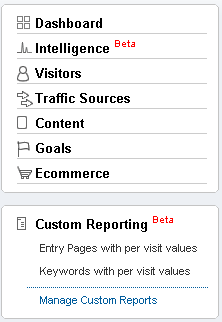
After you save the report, you can pull it up in the Custom Reporting section:
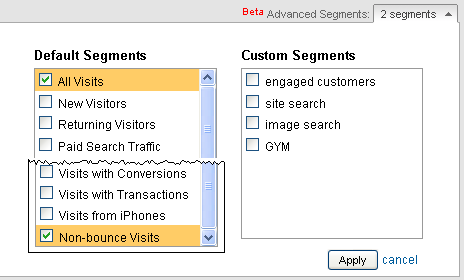
Next, apply the Non-bounce Visits advanced segment alongside the All Visits segment:
Your report should look something like this:
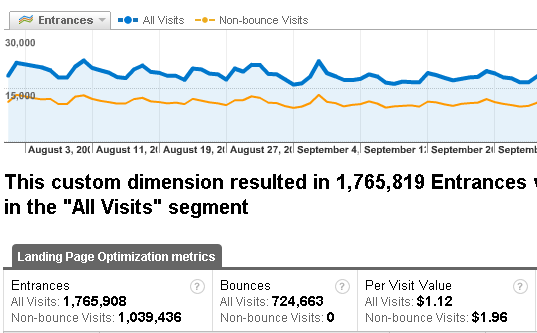
Our custom report now shows overall metrics for all visits and non-bounce visits side-by-side. Check out the difference in per visit values! If I can move some of those 700K bounces into the non-bounce camp it would make a huge difference. Lets say I decrease the number of bounces by 20%. This equates to 724,663 x $1.96 x 20% = $284,000 in additional revenue. Of course, you can’t really take action as it is the aggregate of **all **your (potentially 1000s of) landing pages.
You should therefore look at individual landing pages and prioritize based on potential revenue impact.
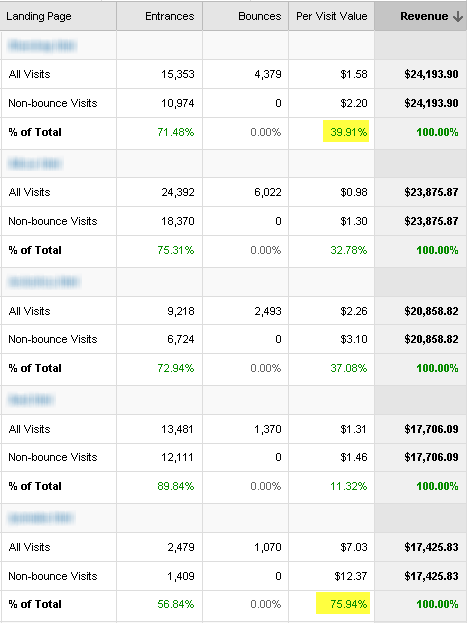
Look for landing pages with large differences in per visit values to guide you. Not only does the last landing page in the above screenshot have a large upside in revenue per visit, but it has a very high revenue per visit to begin with for a comparatively low amount of traffic to it.
Using 20% as our target: 1,070 x $12.37 x 20% = $2,647. Depending on the reporting timeframe, get the yearly value. In this example, we are looking at 3 months worth of data, so the revenue upside is over $10,000 per year. Voilá. Now you also know how much you can invest in optimization. And this is just one page…
Finally, you should also do this kind of analysis for your keywords of course. You can grab the custom report Keywords with per visit values here.
Happy analysis!