Average metrics, context and story
Web AnalyticsAverage metrics are rarely actionable because they hide what’s working and what isn’t. Everything is lumped in together and can be summed up as a**verage metrics = average results **(I think I heard this quote from Jim Novo, but I am not sure).
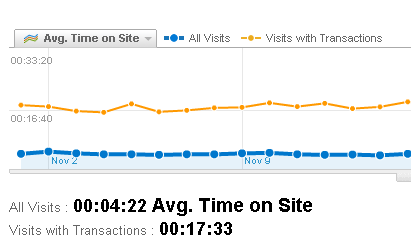
Average metrics can also pretty **boring **in that they often don’t change much over time. Examples are average pageviews/visit or percentage of new visits.
So…are averages basically useless? #
Not if you are actually interested in the average! For one thing, statistics are great at **predicting **averages and it doesn’t cost you much to get an average. I could pick randomly just **five **people in an audience and ask them how tall they are. There is a 93% chance that the median height of the whole audience will be between the smallest and largest heights (from Doug Hubbard’s great book). Statistics are not good at predicting individual behaviours (or heights in this example), but sometimes an average is good enough.
For example, an airplane seat would be designed with average height in mind. It should be more or less usable for most people, but may not be for the very few number of 7-foot tall people. It would be too expensive to accommodate everyone so you try and satisfy the big average. Of course, if the underlying population changes then those averages would shift as well, but I digress.
Average metrics are also useful because they provide you with context. If I can easily get a decent value for average height or average conversion rate then that is far better than nothing at all. If I then segment the data, I can look at this segmented data in relation to the average. So, you really need both the average and the segment in order to understand the context.
And context helps you with story-telling and marketing. Which one would you pick:
- Our average conversion rate is 2.2% and we had 10,000 visitors last month.
- Campaign X had a 5% conversion rate and was seen by 500 visitors.
- Our average conversion rate is 2.2% and we had 10,000 visitors last month, but we had a 5% conversion from campaign X that was seen by 500 visitors.
Doesn’t 3. naturally lead to other questions, such as “should we do more of this”…?
Or how about this:
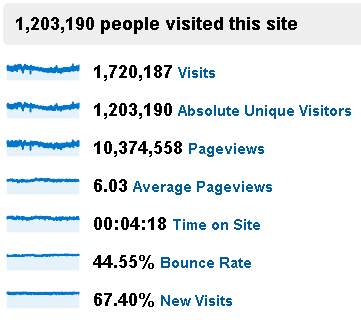
- Last year we had 1,203,190 visitors to our site, who viewed an average of 6.03 pages and spent 4:18 minutes. Yawn.
- Last year we had 1,203,190 visitors to our site, who viewed an average of 6.03 pages and spent 4:18 minutes. That’s over 86,000 hours, or 236 man years!!! This in an incredible and humbling amount of attention given to us, when time is so precious. We have a responsibility to our visitors to help them reach their goals. Let’s dig into the data and start segmenting:
Context based on averages provides you with a way to tell a story based on data. And doesn’t the “right” story lead to more action? Don’t you have to **persuade **your boss to let you do more testing?
Bosses say they want the data and facts, but what they really want is the **story **based on data and facts and context.
- Next: A/B Testing and Lift
- Previous: In-Page Analytics

