Product Conversion Rate
Google AnalyticsWeb AnalyticsYahoo! StoreYou already know that there are lots of conversion rates in your web analytics: Every PPC, keyword or email campaign has a specific conversion rate. But what about the stuff that really matters: the actual products you sell? Shouldn’t products have a conversion rate as well?
When a transaction occurs you can (and should) send the order details to Google Analytics, such as product name, SKU, price, order number. You’ll get very rich data and be able to attribute revenue to your various campaigns.
But this is not enough #
What I also want to know is how many times that product was viewed and whether it was added to cart. You see, Google Analytics doesn’t know that SKU abc123 corresponds to item page abc123.html. With transactions I only know about the (few) successes and not about the (many) misses.
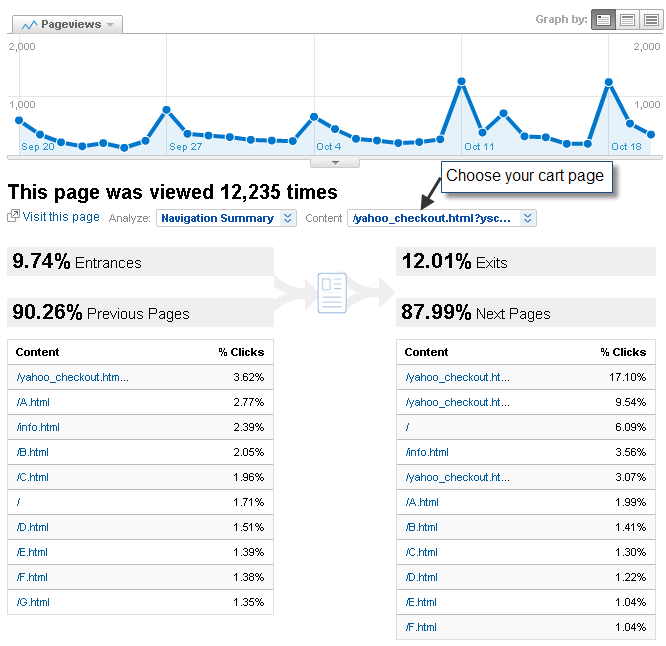
I don’t think there is a decent built-in report that would give you this information out of the box. In order to see the number of add-to-carts I tried using the Navigation Summary report on the cart page.
It shows me the top 10 previous and next pages. I figured that in order to get from one page to the cart page you’d have to hit the add to cart button. Based on the percentage of clicks you can figure out the number of add-to-carts for each of those top 10 previous pages and then compare to the number of SKUs sold. However, the SKUs are only accessible in the e-commerce section so it’s hard to do this efficiently. I am also not sure about the true number of add-to-carts as visitors hit the back button and view other pages, all triggering additional pageviews.
The solution #
The reason for the long intro is that I’d always prefer to get the data directly or without any additional tagging (Occam’s Razor, anyone?), but in this case I don’t think it’s possible. I personally recommend that you use event tracking to capture add-to-carts. I suspect that most add-to-carts are a form post and this is certainly the case for Yahoo! Stores. In the case of Yahoo! Store the product SKU is also the product page so it makes it pretty straightforward to analyze. Here is what I end up with:
The letters correspond to SKUs added to cart. Now I get an e-commerce conversion rate for each event, which translates to: What’s the percentage of visitors who placed an order after adding to cart? I can now start asking some really good questions, such as: Why does H have a far better conversion rate than A? Can I ramp up my targeting for H?
Note that events only live as long as the session. So if someone adds to cart, leaves for a while and lets the session expire, and then finalizes the order in a new session the transaction would not be attributed to the add-to-cart event, but I can live with that.

